This function is used to calculate Remaining Useful Life (RUL).
Examples
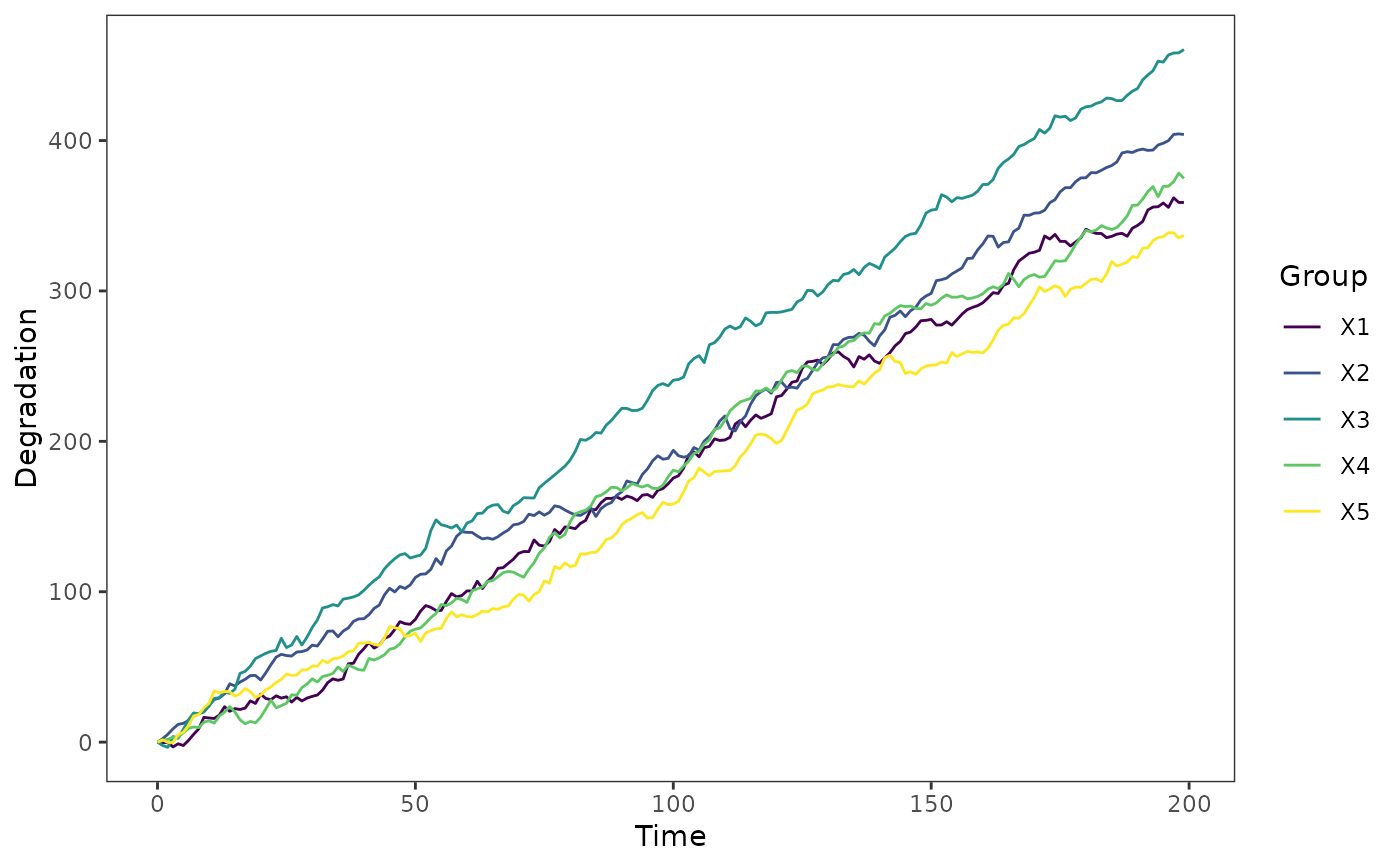
# data simulation (a Wiener linear process with 5 units)
dat <- sim_dat(
group = 5, t = 1:200, para = c(2, 3),
process = "Wiener", type = "classical",
s = NULL, rel = NULL
)
# Plot degradation path
library(ggplot2)
plot_path(dat)
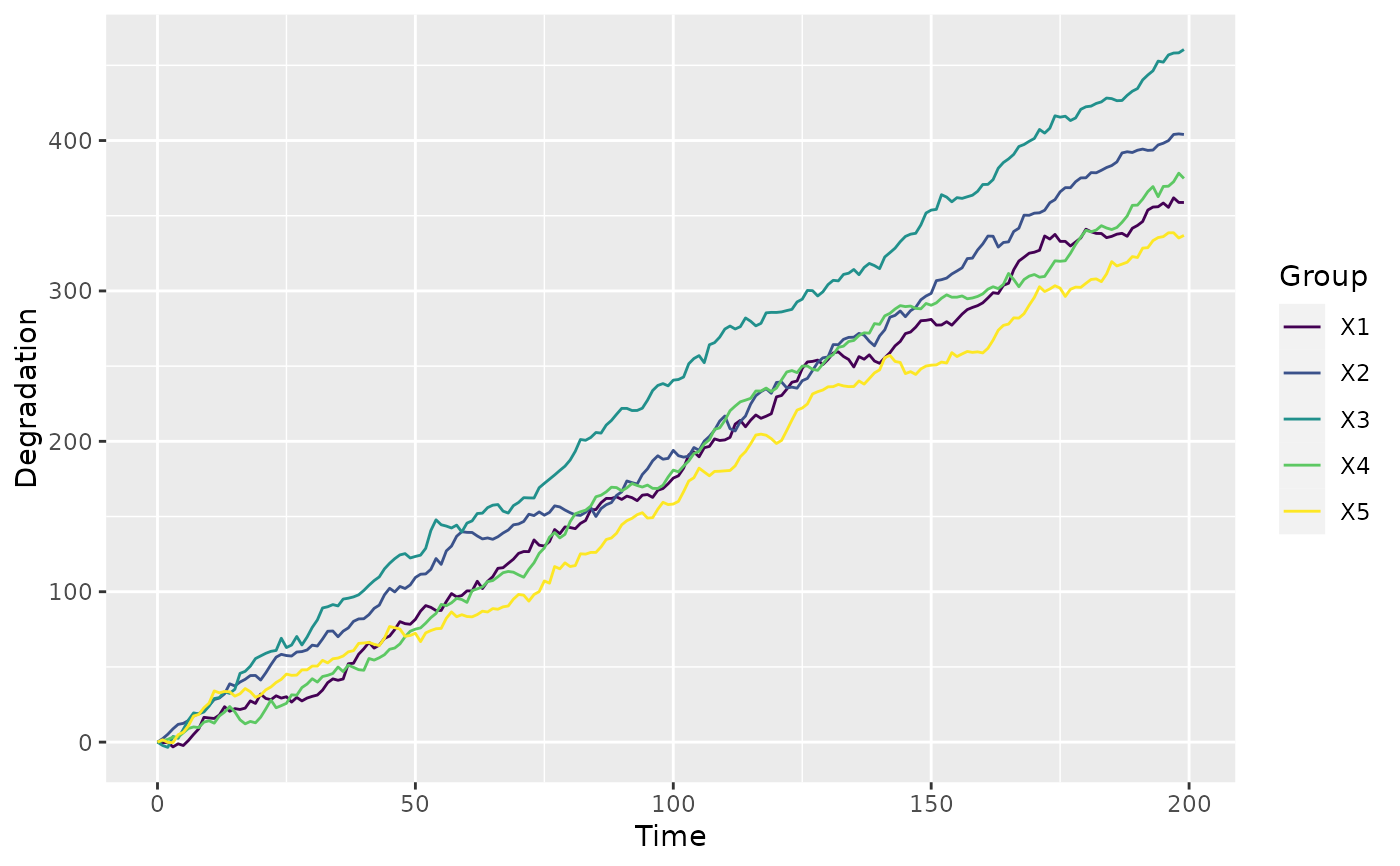 # add ggplot related functions.
plot_path(dat) +
theme_bw() +
theme(panel.grid = element_blank())
# add ggplot related functions.
plot_path(dat) +
theme_bw() +
theme(panel.grid = element_blank())